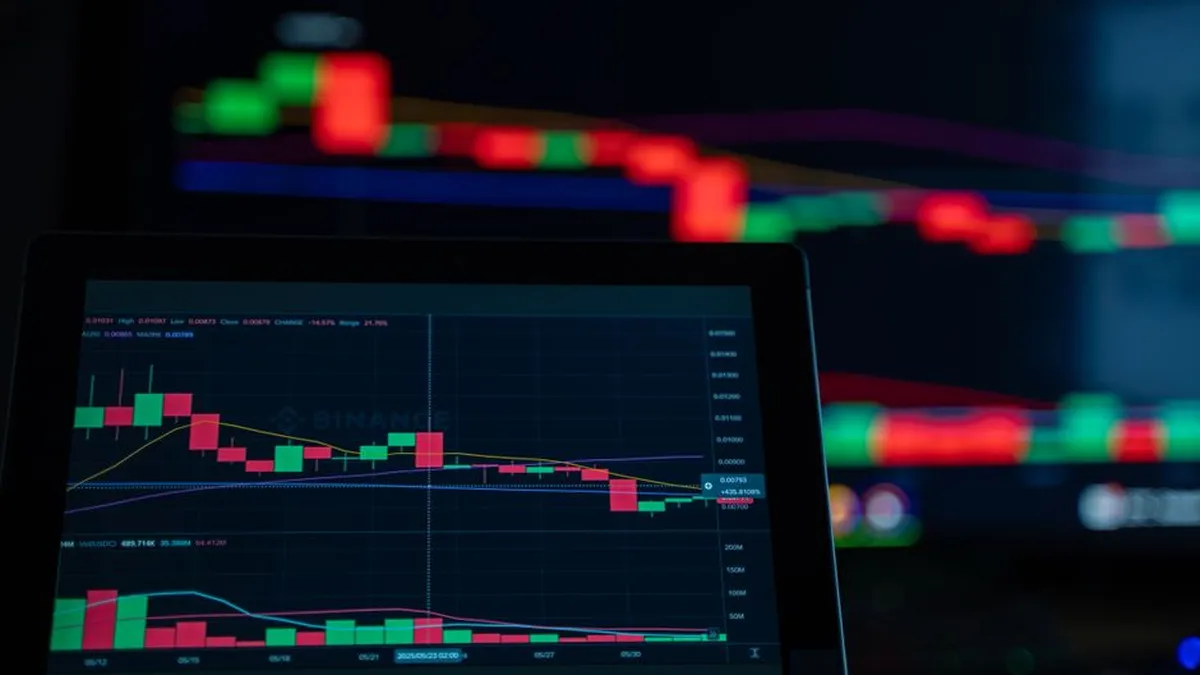

Eight coordinated wallets unloaded 45.64 million $ARIA tokens on April 15, 2026, erasing $277 million in market cap in a single session. The token fell from $1.01 to $0.09, an 85% wipeout in hours. The dump averaged $0.12 per token, generating roughly 5.42 million USDT for the exiting cluster. What had been a $315 million ecosystem became a $38.5 million shell. Trading volume spiked 427.59%, peaking at $221 million on the same session.
I track and trade these setups through AO Shadow — signals auto-copied to Bybit via WebSocket in under 200ms. Free Sentinel tier, no credit card →
The anatomy of a crypto crash via whale pump-and-exit follows one consistent structure. Accumulate a dominant position quietly. Withdraw supply from the exchange to private custody, shrinking the visible float. Let retail FOMO bid the price up into restricted supply. Then return the entire position to the exchange and distribute into the thin order book retail has built. MEXC News reported on April 15 that "tokens moving into exchange wallets signal preparation for further selling."
That's the fingerprint. Tokens leave the exchange weeks before the dump. Price goes up. Then the tokens come back in bulk, and the price goes to zero.
The $ARIA cluster withdrew from Gate.io three weeks before April 15. On-chain analysts flagged the withdrawal. Most retail traders were watching the price chart go up.
This is the same playbook VDOR and UGOR operators used on March 21, 2026, when a wallet cluster crashed UGOR 80% then relaunched under a new ticker. Different name. Identical architecture.
How Whale Clusters Pre-Position Before the Exit
The exchange withdrawal to private custody is the highest-precision pre-dump signal in crypto. When a dominant wallet cluster moves large supply off a centralised exchange into private wallets, it removes that supply from the visible order book without triggering a sell. Reduced visible float creates the illusion of scarcity. Price rises on low volume because sellers are absent. Retail reads this as demand. It isn't.
What it actually is: preparation for controlled re-entry. The cluster withdraws, waits for retail accumulation to build the bid side, then returns the entire position to the exchange in one coordinated move. MEXC's April 15 report confirmed the $ARIA withdrawal-to-private-custody step happened three weeks before the dump. The average dump price of $0.12 became immediate overhead resistance because it represents the cluster's exit floor. Every buyer above $0.09 in the months after is sitting in a distribution band the cluster already left.
The March 2026 VDOR/UGOR sequence used identical mechanics: same wallet cluster, 80% crash on UGOR, relaunch as VDOR. Same operators, new ticker. The market's memory for these patterns is about six weeks.
The tell is always the withdrawal, not the price. Price is the effect. The withdrawal is the cause.
The Distribution Architecture: Why Volume Explodes at the Top
Volume exploding on the dump session isn't a coincidence. It's a structural requirement.
$ARIA's 427.59% volume spike to $221 million on April 15 means the tokens had somewhere to go. Those buyers were retail participants seeing a high-volume candle and reading "confirmation". "This dump created panic within the market," MEXC noted afterward, which somewhat undersells what happened. The panic was the product, not the byproduct.
A coordinated eight-wallet cluster distributing 45.64 million tokens into a thin order book only works because the preceding pump generated buyers. The pump creates the bid. The bid provides exit liquidity. Retail sees volume and price moving up together, interprets it as momentum, and adds to the position. The cluster uses that demand as a clearing mechanism on the way out.
The $0.12 average dump price shows the cluster was patient. They didn't dump at the top into nothing. They distributed across the price range on the way down, using every retail buying impulse as an exit opportunity.
Nae different from any other inventory clearance operation. The product just happens to be tokens.
This is exactly why execution infrastructure matters in the current environment. The best-performing crypto copy trading accounts in April 2026 share one structural trait: predefined exit triggers, not manual reads of volume spikes. You don't beat the cluster on information. You just don't become the exit liquidity.
Bitcoin's Version: The Saylor-vs-Satoshi Tug-of-War
The $ARIA collapse is a low-cap drama. Bitcoin is running the same playbook at a different scale, and the Q1 data says the distribution is accelerating.
Q1 2026 recorded $337 million in daily realised losses from Bitcoin whale wallets, the worst since the post-Luna 2022 capitulation. Smart money is not holding. The distribution pressure from dormant Satoshi-era clusters was large enough that Michael Saylor's Strategy absorbed 17,204.73 BTC in a 48-hour window in April just to hold the range. A morning crypto report cited by U.Today noted that "Saylor's purchases over 48 hours exceeded the Satoshi-era whale's current sell-off by 17 times." That's not organic institutional demand. That's one buyer with an equity printing press.
The Owen Gunden cluster sold $1.3 billion in BTC, sending Bitcoin to $86,000. A $61 million BTC whale was liquidated on HTX in February 2026 during an Extreme Fear print. A Hyperliquid trader opened an $80 million short position in April 2026.
Bitcoin holds near $66,800. One side has Saylor's equity-funded programme. The other has coordinated distribution from wallets that predate the ETF approval cycle.
The scenario nobody's pricing in: Saylor stops buying. If the equity issuance model absorbing this distribution hits turbulence, there's no natural buyer large enough to step into that role. That's your tail risk.
For traders who want protection from this distribution environment, tools active traders are actually using on Bybit in 2026 include on-chain alert integrations and automated risk controls built for exactly this cycle.
Reading the Fingerprints Before the Crash Completes
Three signals together move a whale exit from possible to probable. None require prediction. They're observable before the damage completes.
Exchange outflow to private wallets from concentrated holders. $ARIA's cluster moved supply off Gate.io three weeks before April 15. Centralised exchange withdrawal data is public. The signal was there before the price started moving.
Ownership concentration above a dump-sized threshold. Eight wallets held enough $ARIA to generate 5.42 million USDT in one session. Any cluster controlling more than 5% of float effectively controls the price. Their coordinated action isn't a trade. It's an exit.
Volume spike without a news catalyst. A 427.59% spike with no protocol announcement is distribution. Retail reads it as discovery. It's the cluster clearing inventory.
The data is public. The problem isn't access. It's attention, and the emotional pull of watching a price go up.
| Event | Date | Crash Size | Volume Spike | Market Cap Wiped |
|---|---|---|---|---|
| $ARIA token dump | Apr 15, 2026 | 85% ($1.01 to $0.09) | +427.59% ($221M peak) | $277M ($315M to $38.5M) |
| VDOR/UGOR rug | Mar 21, 2026 | 80% (UGOR) | N/A | Token relaunched as VDOR |
| Owen Gunden BTC dump | Prior 2026 episode | BTC to $86,000 | N/A | $1.3B in BTC sold |
| HTX whale liquidation | Feb 23, 2026 | Extreme Fear print | N/A | $61M BTC liquidated |
FAQ
What is the anatomy of a whale pump-and-exit crypto crash?
A whale pump-and-exit follows four steps: accumulate quietly, withdraw supply from an exchange to private custody to create low-float scarcity, allow retail FOMO to bid the price up, then return the entire position and distribute into the retail-generated bid. The $ARIA collapse on April 15, 2026 erased $277 million in market cap following this exact structure.
How did eight wallets crash $ARIA by 85% in April 2026?
Eight coordinated wallets dumped 45.64 million $ARIA tokens on April 15, 2026, averaging $0.12 per token for approximately 5.42 million USDT total. The crash ran from $1.01 to $0.09, wiping $277 million in market cap. Volume spiked 427.59% as retail buyers absorbed the exit. The cluster had pre-positioned by withdrawing from Gate.io three weeks earlier.
What on-chain signals predict a whale exit before the price crashes?
Three high-confidence signals: large supply moving from a centralised exchange to private wallets; concentrated ownership above 5% of float in any single cluster; and a volume spike without a news catalyst. All three were present in $ARIA. The Gate.io withdrawal occurred three weeks before the April 15 dump, making the pattern observable before the crash.
Is Bitcoin facing similar whale distribution pressure in 2026?
Q1 2026 recorded $337 million in daily realised Bitcoin losses from whale wallets, worst since the post-Luna 2022 bear market. The Owen Gunden cluster sold $1.3 billion in BTC. A Hyperliquid trader opened an $80 million short in April 2026. The mechanics mirror the low-cap rug pattern, just at a scale requiring Saylor's 17,204.73 BTC 48-hour purchase to absorb it.
How should traders protect themselves from whale exit dumps?
Avoid tokens where any single wallet cluster holds more than 5% of float. Track exchange inflow and outflow from dormant wallets. Use automated position exits rather than emotional manual decisions. Scale into Bitcoin weakness rather than strength. The objective is not predicting the dump. It's refusing to be the exit liquidity when the cluster moves.
The whale exit playbook is running across timeframes and market caps in 2026, from $38.5 million $ARIA shells to $1.3 billion BTC distributions. Q1's $337 million daily whale loss realisation is the highest since 2022. The traders who survive this environment don't have better information. They have systems that execute exits before panic sets in. AO Shadow automates those exits for free, copy-trading a verified track record without the emotional decision-making whale operators rely on to generate their exit liquidity.