Gold just printed $5,419 per ounce. Let that sink in. On March 3, 2026, the yellow metal hit an intraday all-time high as U.S.-Israel strikes on Iran sent traders scrambling for safety. As of March 9, we're sitting at $5,092/oz — a pullback, sure, but still up 76% year-over-year from $2,888 in March 2025. Fortune reports the current spot price confirms this number. I've been trading gold since the NYMEX floor days, and I've never seen anything like this. Not in 2008. Not during COVID. Not when we broke $2,500 in 2024. The metal has added roughly $3,300 per ounce in two years. That's not a rally. That's a regime change.
I track and trade these setups through AO Shadow — signals auto-copied to Bybit via WebSocket in under 200ms. Free Sentinel tier, no credit card →
I'm still long. But I'm not chasing.
Why Gold
Is Ripping and Won't Stop Soon
Look. There's no single catalyst here. It's a pile-up.
Central banks are hoovering up gold at ~585 tonnes per quarter. China and India are actively diversifying out of dollar reserves. That's not speculation — that's GoldRepublic's breakdown of the structural demand shift. The Fed is expected to cut rates, which has always been rocket fuel for gold. Inflation hasn't gone away. And then you've got a shooting war in the Middle East.
Thomas Winmill, Portfolio Manager at Midas Funds, puts it bluntly: "Gold will reach prices of over $5,500 per ounce in the next month or two, driven by strong demand from central banks, particularly those diversifying away from U.S. securities."
He's probably right. Maybe conservative.
Goldman Sachs raised their year-end target to $5,400. J.P. Morgan is calling $6,300 by December 2026. Even ING — who are usually cautious — see gold averaging $5,190 for the year. Scotiabank is the lone bear at $4,100, and I think they'll revise upward within 60 days.
The Great
Divergence: Gold and Yields Rising Together
Here's the thing. This rally breaks every textbook rule.
Gold is supposed to fall when yields rise. Higher rates mean higher opportunity cost for holding a non-yielding asset. That's Econ 101. But right now the 10-year Treasury is sitting at 4.107% and gold just hit an all-time high. Financial Content's analysis calls this 'The Great Divergence' — and that name fits.
So what's going on? The market is pricing in something rates can't fix. Structural de-dollarization. Sovereign risk. Geopolitical premiums we haven't seen since the Cold War. When both gold and bonds sell at premium prices at the same time, capital has nowhere comfortable to hide.
I've been trading for over two decades. This divergence is the single most important signal in markets right now. The old correlations are dead.
Key Levels:
Where I'm Buying and Where I'm Cutting
The technicals are clean. Price is above the 20-, 50-, 100-, and 200-day moving averages. The 14-day RSI sits at 63.9 — upper-neutral but not overbought. There's room to run before we hit 70.
| Level | Price | Note | | All-time high | $5,419 | March 3 intraday peak | | Current price | $5,092 | As of March 9 | | Key resistance | $5,572 | Next technical target | | 100-day MA | $4,477 | Major support / stop zone |
| 200-day MA | ~$4,100 | Last-resort support |
|---|
My positioning: I added to longs on the pullback from $5,419 to $5,092. Stop-loss sits below the 100-day MA at $4,450. That's a wide stop — roughly 12.6% — but at this volatility, anything tighter gets you whipsawed out. Target is $5,500 near-term, $6,000+ by Q4 if central bank demand holds.
If we break below $4,477 on volume, I'm flat. No ego. The trade is wrong.
The Whole
Precious Metals Complex Is Bid
Gold isn't alone. Capital.com's forecast notes the broader metals rally tied to geopolitical risk. Silver is trading at $84/oz. Platinum at $2,145. Palladium at $1,640. When the entire complex moves together, it's not a gold story. It's a fiat currency story.
Silver's gold-silver ratio is worth watching. At current prices, it sits around 60.6 — below the long-term average of ~68. Silver is outperforming on a relative basis. That usually happens in the late stages of a precious metals bull run, when retail piles in. We're not at euphoria yet. Getting closer though.
For traders who want metals exposure without single-commodity risk, the broad precious metals basket is the smart play. But gold remains king. It always is when governments start printing and shooting at the same time.
Three Things
That Kill This Rally
I'm bullish. But I'm not blind.
A Middle East ceasefire. Any real diplomatic breakthrough pulls the geopolitical premium out of gold fast. We already saw it — gold dropped from $5,419 to $5,092 in days once the initial Iran panic cooled. The Sunday Guardian covered the initial spike. A real peace deal could trigger a 10-15% correction.
The Fed holds rates. If Powell signals no cuts coming, gold loses one pillar of support. It won't crash — the other drivers are too strong — but it stalls.
Central bank buying dries up. That 585 tonnes/quarter demand is the structural floor. Any sign of China or India pulling back and we retest $4,800.
None of these are my base case. But any of them warrant tightening stops.
Traders looking to build systematic approaches to managing positions across volatile markets — whether in commodities or forex — can explore how AO Shadow handles automated position management and risk controls.
How Much
Is 1 Oz of Gold Right Now?
As of March 9, 2026, one troy ounce of gold trades at about $5,092. That's down from the all-time intraday high of $5,419 set on March 3. A year ago, that same ounce cost you $2,888. Two years ago, roughly $2,100.
Put differently: if you bought a single ounce in March 2024 at $2,100, you're sitting on $2,992 in unrealized profit. That's a 142% return in 24 months. Stocks didn't do that. Bonds sure as hell didn't.
How Do
You Safely Buy Gold?
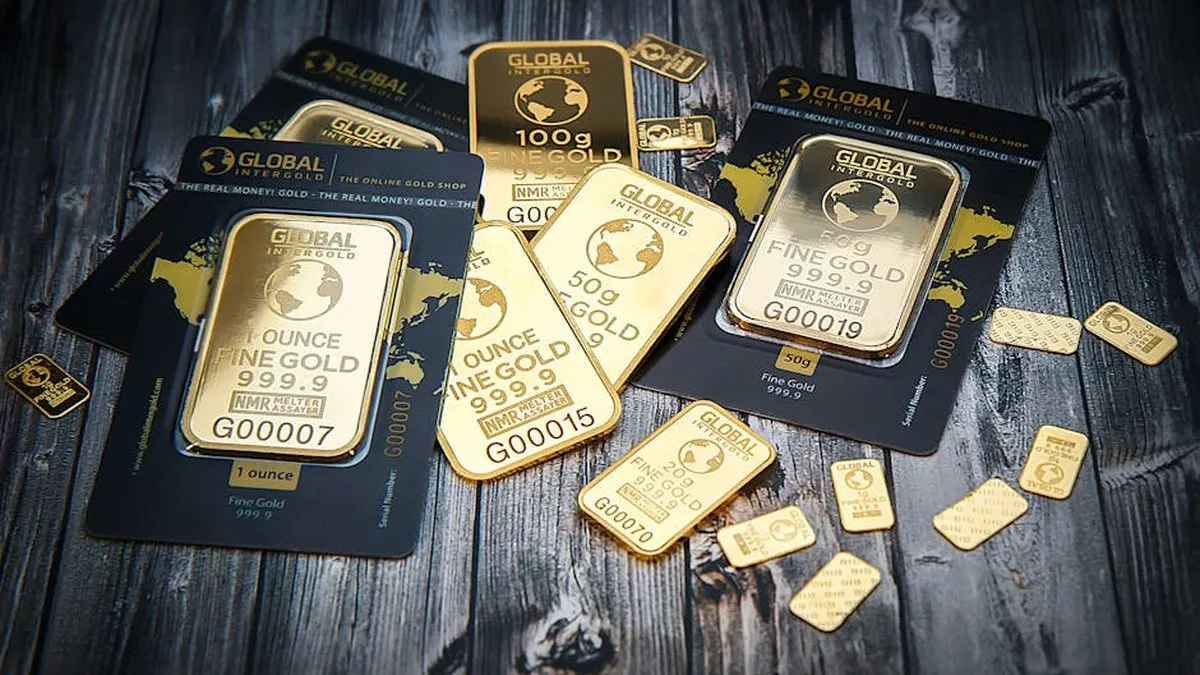
Physical bullion from reputable dealers is still the safest route. APMEX, JM Bullion, or your local coin dealer all work. Just make sure you're buying from an accredited source with transparent premiums.
For paper exposure, gold ETFs like GLD and IAU are liquid and cheap to hold. Allocated gold accounts through banks are another option. As Fortune's advisory analysis notes, "Gold may be the right choice for investors seeking assets not directly tied to inflation variance."
At $5,092, don't dump your life savings in at once. Dollar-cost averaging is the only sane approach at these levels. Buy a fixed dollar amount monthly. Set it and forget it. If gold corrects 15%, you got a better average. If it keeps running, you're in.
FAQ
How much is 1 oz of gold right now?
One troy ounce of gold trades at about $5,092 as of March 9, 2026. That's a 76% year-over-year gain from $2,888 in March 2025. The all-time intraday high of $5,419 was reached on March 3 during the Iran escalation.
Will gold prices keep going up in 2026?
Most major banks think so. Goldman Sachs targets $5,400. J.P. Morgan sees $6,300 by year-end 2026. Central bank demand at 585 tonnes per quarter puts a structural floor under prices. Only a Middle East de-escalation or a Fed policy surprise would seriously threaten the rally.
Is gold a good investment at $5,000?
Gold has averaged 7.9% annual returns since 1971. It's a proven store of value and inflation hedge. But at these levels, dollar-cost averaging beats lump-sum buying. Position sizing matters too — most advisors suggest 5-15% portfolio allocation to precious metals.
What is driving the gold price rally in 2026?
Four things at once: central bank de-dollarization purchases averaging 585 tonnes per quarter, persistent inflation expectations, anticipated Fed and ECB rate cuts, and a geopolitical risk premium from U.S.-Israel military strikes on Iran. That combination pushed gold past $5,000 for the first time.
What is the gold-to-silver ratio right now?
About 60.6, with gold at $5,092 and silver at $84 per ounce. That's below the long-term average of roughly 68, which means silver is outperforming gold on a relative basis. This pattern tends to show up in later-stage precious metals bull markets.
Want to trade these moves automatically? AO Shadow copies live signals from professional traders directly to your Bybit account via WebSocket — entry, take-profit and stop-loss placed in under 200ms. The Sentinel tier is free forever, no credit card required. Start your free trial →